


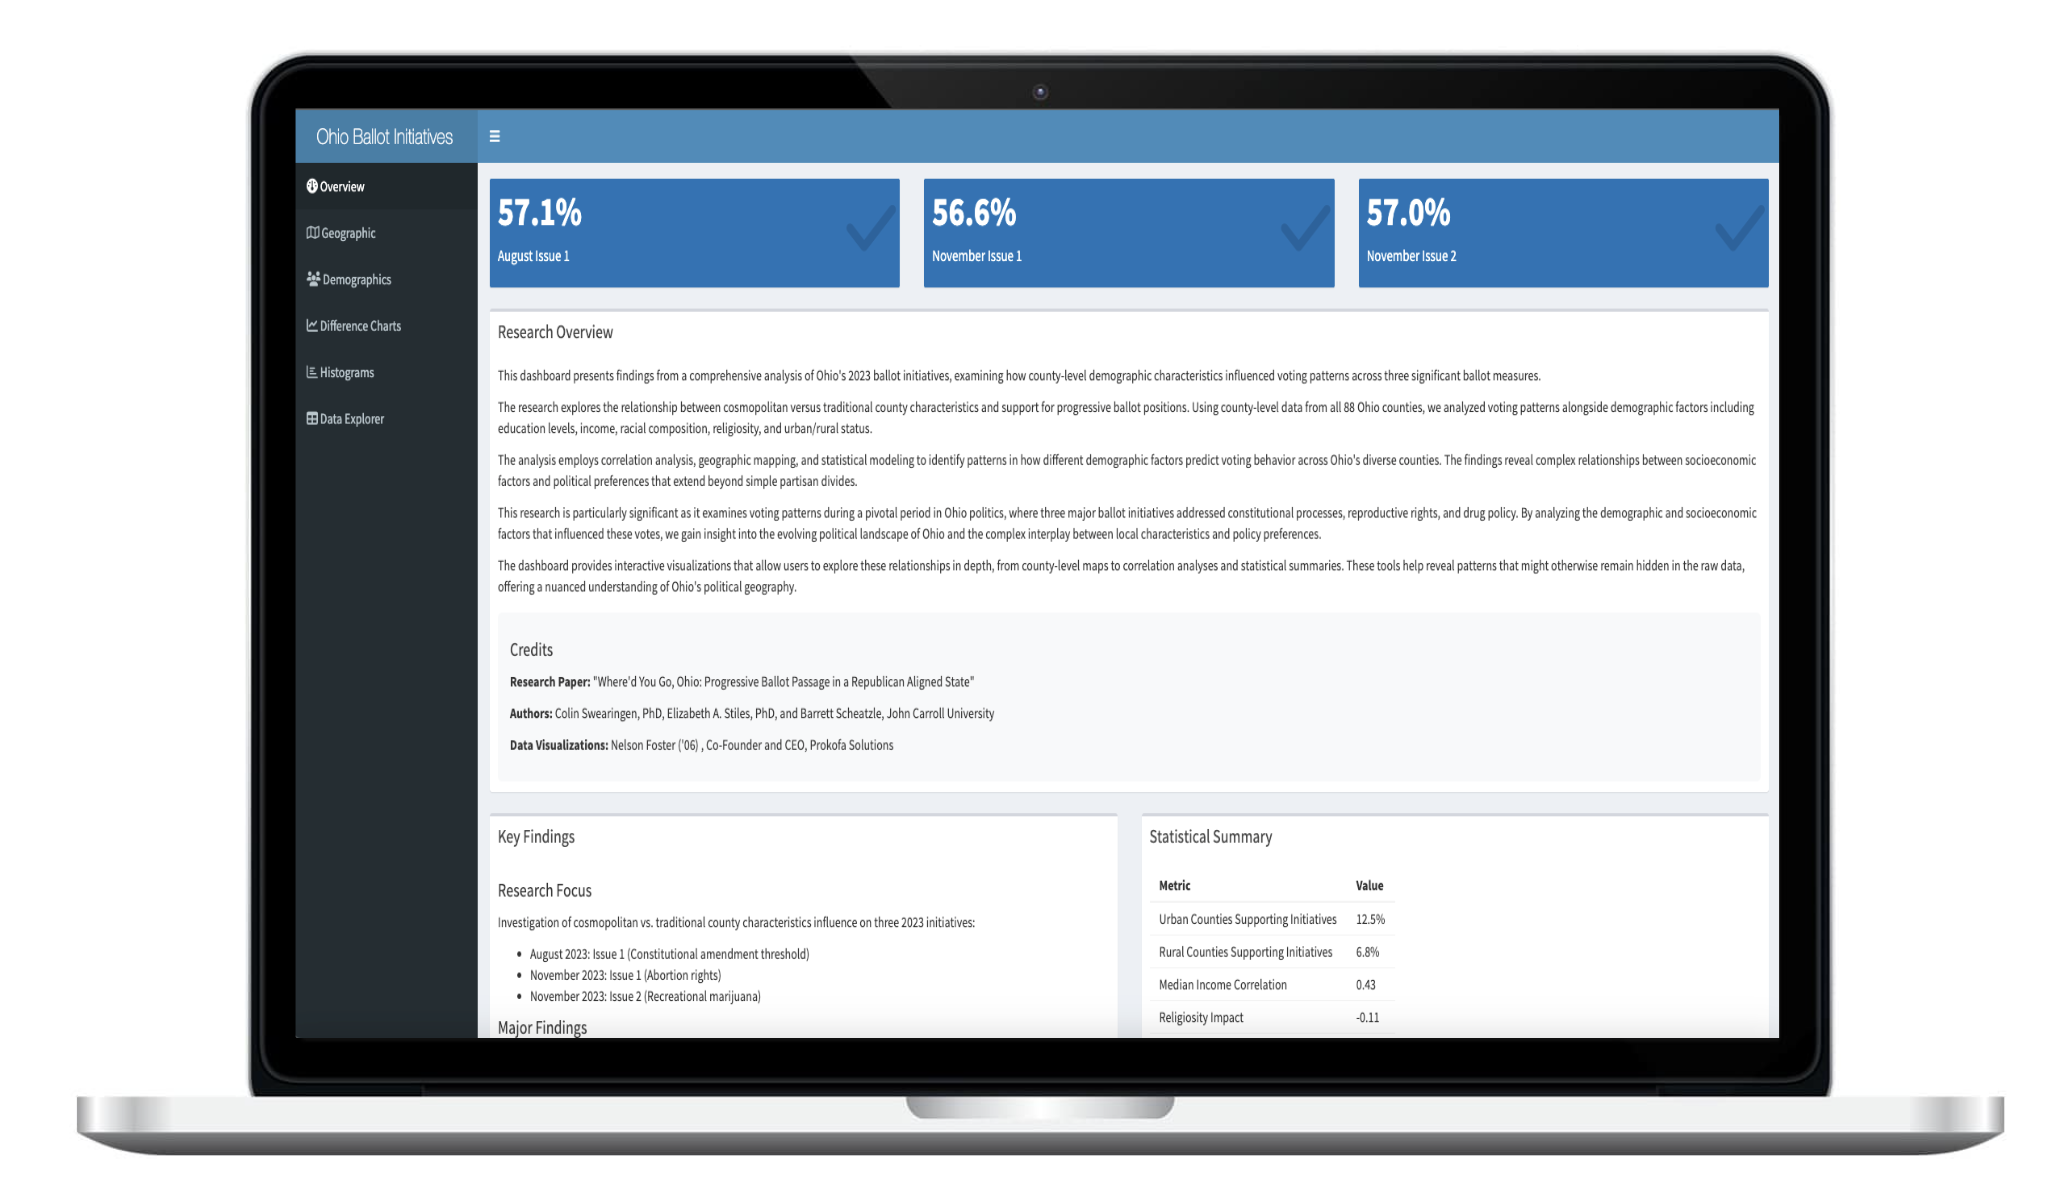
Project Overview
The Ohio Ballot Initiatives dashboard is an interactive data visualization tool that allows users to explore how demographic factors correlate with voting patterns across Ohio's 88 counties. By leveraging public data from the US Census Bureau, election results, and other sources, this dashboard presents a comprehensive analysis of how education, income, racial composition, religiosity, and urban/rural status relate to voting outcomes on key ballot initiatives.
This work was born from a concept to transform flat datasets and academic papers into interactive dashboards that democratize access to insights, raise awareness, and inspire action. I built this tool to help political analysts, campaign strategists, and civic organizations better understand the electorate and develop more targeted, effective messaging. The dashboard features choropleth maps, scatter plots, and statistical correlation analyses that make complex voting data accessible and actionable.