


Project Overview
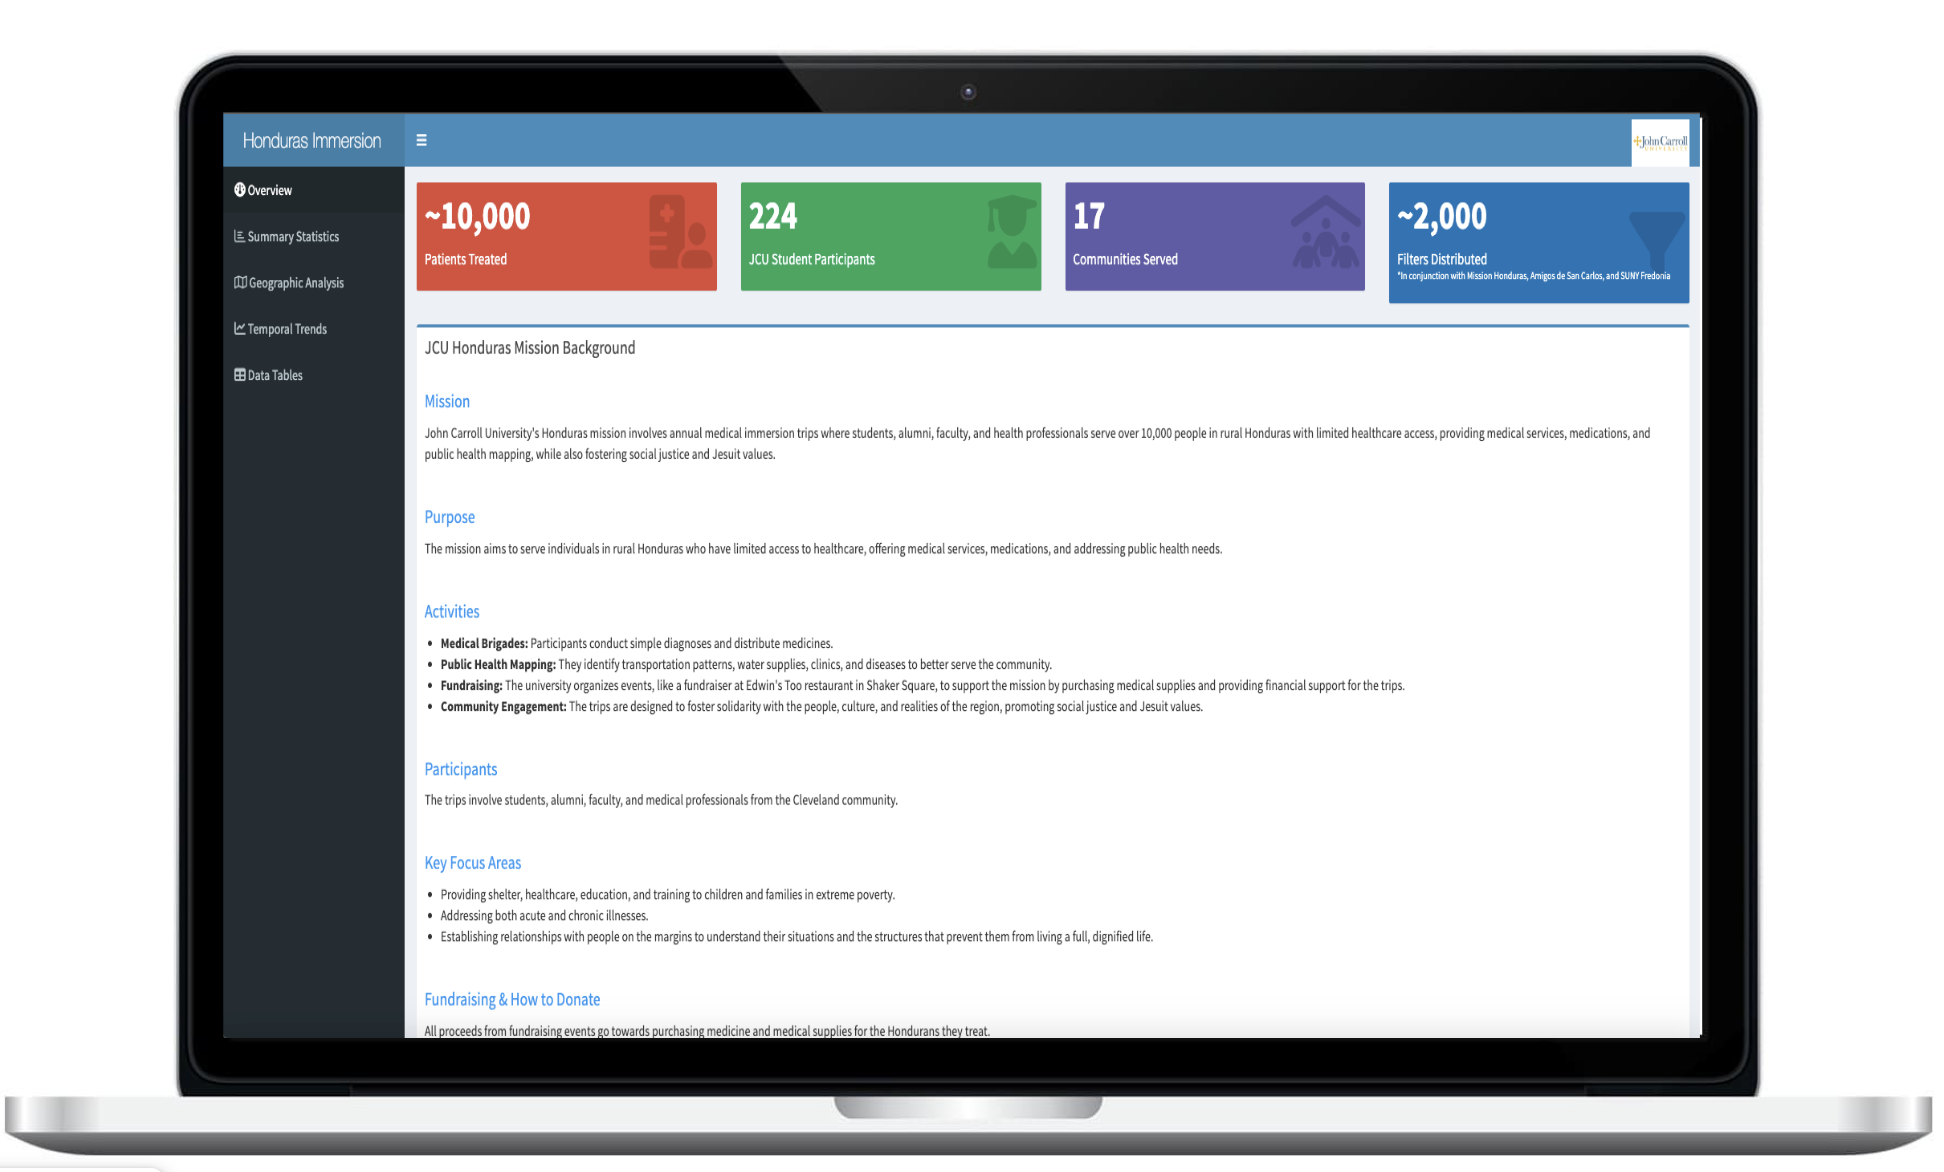
The Water Quality and Preventable Illness dashboard is an interactive data visualization tool that explores the relationship between water quality indicators and health outcomes in rural communities. This comprehensive platform integrates diverse datasets from water quality measurements, illness reports, and environmental factors to provide a holistic view of how water contamination impacts community health.
This work was born from a concept to transform flat datasets and academic papers into interactive dashboards that democratize access to insights, raise awareness, and inspire action. I built this tool to help healthcare providers, public health officials, and community organizations identify at-risk areas and develop targeted interventions. The dashboard features geospatial mapping, temporal trend analysis, and statistical correlations that make complex environmental health data accessible and actionable.
The resulting platform incorporates real-time data feeds, customizable views, and drill-down capabilities that allow users to explore data at various levels of granularity. This significantly reduced the time required for routine reporting and enabled faster, more confident decision-making for organizations working to improve water quality and reduce preventable illnesses in vulnerable communities.